 | |||||||||||
|
|
Journals 2006/2007Tamara Browning
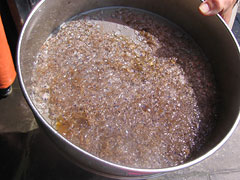
August 24, 2006 Yesterday the ALBATROSS IV set out to sea again on the northern stage of the cruise, which will take up to ten days to complete. There were four new members of the science group onboard: Karla Heidelberg, a marine biologist from the University of Southern California; Tracey Jamula, a summer intern student who working with Don Cobb; Alicea Bursey, a volunteer and Wes Dukes from the National Marine Fisheries Service in Woods Hole. The science group has been assigned to new shifts and my duty hours were now 3:00 a.m. to 3:00 p.m., hours that I definitely found more difficult to get used to! On my first shift I worked with Jerry in the CTD lab as he explained and demonstrated how the sampling site and CTD data was entered into the computer database when we reached each of the stations. There were two computer programs used for this process and each involved multiple steps. Jerry assured me that after I had gone through this data logging process several times it would become second nature to me. That was welcome news as it certainly seemed complicated the first time around. Another first was awaiting me when I examined the contents of the plankton nets. At this site the trawl had brought up a swarm of transparent, gelatinous creatures, about two centimeters in diameter, that each had a single black dot at the center of their bodies. These were something called salps, and the black dot was their digestive system filled with a meal they had just eaten. At the next site the plankton trawl brought up yet another type of weird and wonderful creature that I had not seen before. This time it was a bunch of little wiggly shrimp-like animals called isopods. The isopods clung tightly to the walls of the net with their many legs and were very uncooperative about being flushed out. Even prolonged and focused hosing could not dislodge the most tenacious among them, and I resorted to picking those stragglers out of the net individually using tweezers.
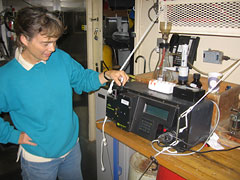
The nets used for the plankton trawls have a mesh size that is just right for catching zooplankton, but anything smaller such as phytoplankton, float right on through. So I asked Jerry how the phytoplankton were recorded and measured. For this job an instrument called a flow through fluorometer was used. Water from two meters below the surface was continuously pumped through the fluorometer and it automatically logged readings of chlorophyll concentration every ten seconds. There was another fluorometer in the lab that was used for calibrating the flow through version to make sure its readings were accurate.
Chlorophyll concentration is directly related to phytoplankton abundance since all phytoplankton contain the chlorophyll pigment. Inside the fluorometer a specific wavelength of light, selectively absorbed by chlorophyll, is shone through the water sample. The chlorophyll absorbs this light energy and re-emits it at a different wavelength causing the pigment to fluoresce. Sensors inside the fluorometer detect and measure the intensity of fluorescence and use a mathematical formula to convert the measurement into micrograms of chlorophyll per liter of water. So, measurement of phytoplankton abundance in the ocean was achieved through the indirect methods described above, was automated, occurred continuously, and did not include species identification. In contrast, zooplankton abundance was measured at discrete intervals (at the sampling sites) required human input to count and classify the organisms (done in the lab) and did aim to include species identification. |
||||||||||