 | |||||||||||||||
|
|
Journals 2009/2010Jonathan Pazol
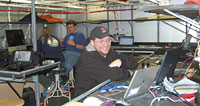
August 24, 2009 Throughout my Journals, I have tried to explain why we are out here, what the scientists are doing, what data we are collecting, and then what is done with the data. There is still one more piece to the scientific part of the puzzle - where does this data end up and how is it used? Multibeam echosounder and "Chirp" seismic data get collected, processed, and then put into the Fledermaus program. From there, the data can be used in a variety of ways. (As an aside, the word "Fledermaus" means "bat" (the animal - literally "flying mouse") in German. The original developer of part of the program had developed a computer mouse/joystick that could move in 3D (long before the Wii) that they called a "flying mouse." It was also shaped like a baseball bat. They used the German "Fledermaus" because it sounded like a cooler name for a software program than "Bat." Later, as the program was implemented into echosounding, which is similar to how bats (the animals) navigate, the name became even more appropriate). Once the data has been inputted into Fledermaus, Will Fessenden - the GIS (Geographical Information Systems) person, puts it into a program called ArcMap, a commonly used 2D program. ArcMap, like Fledermaus, is also a geo-referenced program, meaning that the data is matched up with specific latitude and longitude points on published maps. This program shows the bathymetry (sea floor map), navigation information, depth, and seismic profiles for this cruise, as well as for others that have occurred. A good way to think about this program is that it's like Google Maps, but instead of being able to "zoom" down to the street level, you can "zoom" into an area on the ocean floor. The data sets are hosted on CCOM's (Center for Coastal and Ocean Mapping) server and are available for use by researchers, or others who request it. Some of the uses include updating the IBCAO (International Bathymetric Chart of the Arctic Ocean) maps or for Law of the Sea claims.
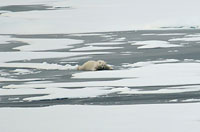
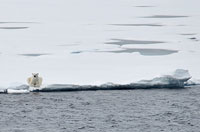
Another project currently being done on the Healy is an update of a program called CUBE (Combined Uncertainty and Bathymetry Estimator). Brian Calder, who is a Research Associate Professor at UNH and part of CCOM, developed an algorithm (computer code/program) that could be used to process bathymetric data. In the past, for every hour of data that was collected, it would take about 10 hours of processing time to get it onto a surface navigation chart - the maps that are used by ships in order to avoid hazards. These charts are mainly concerned with those sea floor features that are "shoalest" (shallowest). Deeper sea floor and other geophysical data is not used; however, the rest of this data is still needed for other uses. Consequently, Brian led the development of the CUBE program, which is used by the vast majority of companies that have hydrographic data processing software. It has reduced processing time considerably, so that now 30 hours of data collection can be processed in as little as 5 hours. This data can not only be used for surface navigation charts but it can also be used for tsunami inundation models (seeing how the ocean floor affects tsunami formation), coastal zone mapping, and any other projects that use sea floor features. The CUBE program is highly complex, but I hope I've been able to explain it accurately - it's truly an impressive contribution to the field. Okay, here are some obligatory polar bear pictures from the other day - compliments of Coast Guard PA3 (Public Affairs) Patrick Kelly, whose job is to document our expedition for the Coast Guard and who has both a great lens on his camera and an excellent eye.
|
||||||||||||||