 | |||||||||||
|
|
Journals 2009/2010Jonathan Pazol
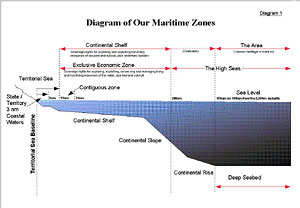
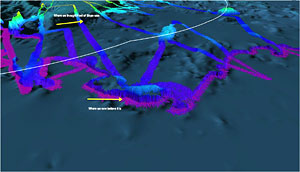
August 12, 2009 Data collection and work on the watch have been pretty quiet. We are leading the Louis in pretty much of a straight line north. On the Icefloe website http://www.icefloe.net/reports_healy.html you can follow our path and learn other information about the ship and current conditions. While on watch part of my job has been to keep track of the multibeam sonar. The computer then generates a wide, colored line on the screen. When there are different features on the sea floor, the computer shows a wide variety of colors. When the sea floor is flat, there is only one - purple. We are following a long, long, long purple line. Because of this, I have time to learn more about the entire expedition, including experiments and life on the ship, so various journal entries will focus on these as well. At our science meeting, Larry Mayer, chief scientist from the University of New Hampshire, gave a presentation on, "Why We're Here." I know I tried to explain the expedition to people before I left, but now I am beginning to understand it much better. Future journal entries will describe all the pieces of the puzzle in more detail, but for now, here's an overview. If you travel 200 miles off a country's coast, you are in what is called an Exclusive Economic Zone (EEZ). This is the area in which a country has the right to use the resources in the water column (the water itself) and under the seafloor in any way they choose. Countries can fish, extract oil, establish protection for marine mammals, etc. in this zone without interference from other countries. What happens beyond that 200 mile zone is another story. Countries have said that they have rights to resources beyond these zones, but how are these rights proven? Where does one country's boundary end and another's begin? The simple answer lies in figuring out the boundaries of the continental shelf. For geologists, the continental shelf is the continuation of the continental land under the sea before it slopes down to the sea floor, yet this issue is not solely a geologic one.
In 1982 and with later revisions, the United Nations adopted what is called the Convention of the Law of the Sea. Act 76, a total of 617 words, redefined the continental shelf in a legal sense and provided a procedure for a country to extend their legal rights. This new definition provided access for countries to the resources of the sea bed and subsoil (gas, oil, gas hydrates, and any bottom dwelling organisms, such as mussels and clams), not those in the water column (fish, algae, marine mammals, etc.). With a new definition of continental shelf then, how does a country prove their rights? Mapping. The main focus of this entire expedition is to help both the United States and Canada jointly map the sea floor in an effort to determine the limits of the continental shelf. The formula is complicated and is affected by things such as the depth, shape of the sea floor, and the thickness of sediments (layers of mud, silt, some rock, etc.) on the bottom. In the Arctic, five countries have extended continental shelf rights because their lands surround the pole- the US, Canada, Russia, Norway, and Denmark (through Greenland). Consequently, each country needs to determine, through mapping and seismic data, where their shelf boundaries are. Larry Mayer and the Healy have been doing this on four cruises since 2003. Before they started the project, they had an idea of the limits of the continental shelf - determined in part by a feature called Foot of Slope (FOS). Each time they have come out, more data has shown that these limits have changed. The map generated from the multibeam sonar shows Alaska out of view at the top of the picture.
As of now only 6% of the Arctic Ocean has been mapped. This year's focus is to increase that percentage. That's why we're here. |
||||||||||