 | |||||||||||
|
|
Journals 2009/2010Teresa Gable
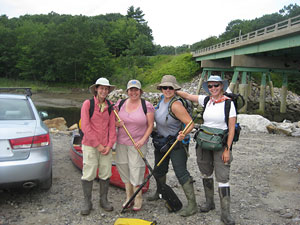
August 12, 2009 Today, the "all girl team" picked me up at the hotel in Bath and we headed for the Sherman Marsh site. This time we had a canoe to use for transportation to the first transect. Since there were four of us, we had to shuttle to the site and make two trips with passengers and equipment. This took a bit of time but it was better than walking around the salt marsh to get to the site.
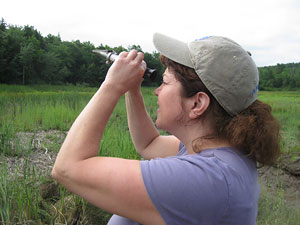
While waiting, we ran into another group of researchers from the Department of Transportation working on cutting the flowering tips off invasive common reed (Phragmites) growing on the marsh. This technique is useful to stop the invasive plants from reproducing and spreading. It is labor intensive work. There are other people working and studying this unusual marsh environment. We climbed out of the canoe and walked over to our first transect. This part of the marsh was very picturesque. It had a different feel to it. Today, we had more of a rhythm to our teamwork and everything went pretty smoothly. Jennifer and I had the job of trying to find each plot along the transect. Once found, we laid down the poles then took a picture of the plot. We had to make sure to record which plot it was and the photo would be used as a reference backup for the data. Also, we counted the cattails and measured the height of the tallest three plants in each plot. Cattails are a freshwater species and the researchers are monitoring the migration and disappearance of the cattails. As the salt marsh becomes saltier the cattails will eventually be replaced by a more salt tolerant species. Our last task was to measure the soil salinity at various salinity wells along the transects. We use a refractometer and held it up to the light to see the salinity levels. Since it has been a rainy summer, the salinity levels were very low for a salt marsh.
Abby and Elizabeth followed behind, identifying and recording the different species of plants within each plot. There are 50 points within each plot and they record what plants are present at each point in the grid to determine percentage of cover for each plant. Back in the lab, the data will be entered into a computer for analysis. Each year's worth of data will be compared with the previous years' data to monitor the changes in vegetation with the salt marsh. In the next few days we will visit a reference salt marsh, which they monitor in the same way and can use to compare with Sherman Marsh. The reference marsh represents what the researchers expect Sherman Marsh to look like some day. |
||||||||||