 | |||||||||||||||||||||||||
|
|
Journals 2006/2007Kirk Beckendorf
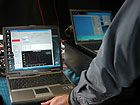
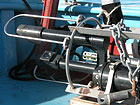
September 1, 2006 We saw more whales, a few seals, and thousands of birds today while we ran another line. As usual we started close to shore. After deploying the ADCP and the Acrobat we headed northward. Onboard the Annika Marie, the laptops received the water temp, salinity and chlorophyll data. Keep in mind that the main focus of this project is to study the bowhead whale's food web. In simple terms, the bowhead is at the top of the food chain; the whales eat zooplankton (which are tiny animals), which eat the phytoplankton (tiny photosynthetic organisms like algae and other microorganisms). Marine (ocean) food chains are similar to ecosystems on land, but there are also differences. Just like on land, at the base of the food chain are organisms that use chlorophyll to photosynthesize (turn sunlight into food). Ev and Barry explain to me that, unlike on land, most of these photosynthetic critters are not large plants but are microscopic phytoplankton. Zooplankton eat the microbes and other phytoplankton. The zooplankton are tiny animals like krill and copepods- the two main food sources of the bowhead whale. Krill look like tiny shrimp and copepods look similar to and are about the size of fleas. So what does this have to do with the data coming in from the Acrobat? As we tow the Acrobat, the incoming data is monitored. The computer on the left shows the water temperature, the amount of little particles, and the amount of chlorophyll in the water. The red line on the laptop on the right shows the flight of the Acrobat up and down in the water and the black line shows the sea floor.
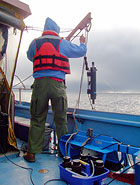
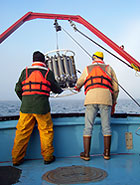
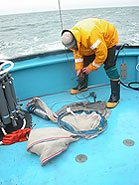
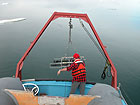
As mentioned the other day the seawater varies from place to place. After we tow for a while the data on the computer is analyzed to determine where we should collect more data about the water and where to collect plankton. Bill, the boat captain, turns us around and we retrace our route stopping at areas that had high concentrations of chlorophyll- indicating high concentrations of phytoplankton. At each stop a number of collections are made. Aaron collects water for Bob and Ev to study the phytoplankton; Steve lowers a CTD to the sea floor to collect detailed temperature, chlorophyll and salinity data about the water column. Bob uses plankton nets to collect zooplankton and Phil lowers a VPR (an underwater microscope/camera) to the seafloor to photograph plankton throughout the water column.
Question of the day: Actually the bowhead whale is not the top of the food chain, what is at the top? |
||||||||||||||||||||||||